
The Enhanced Forecasting Worksheet from Insight Works gives planners and consultants direct control over how forecast data translates into actionable inventory parameters. This addresses a common gap in standard Business Central setups: Azure ML predictions arrive but lack a tailored application for specific item behaviors.
The Enhanced Forecasting Worksheet is free for one named user per Business Central environment. Additional users require a paid subscription. No time limits or feature restrictions apply to the single-user license. Install from Microsoft Marketplace.
Planners often face demand that varies by item type, location, or supplier lead times. Standard forecasts provide quantities per period, but they do not automatically adjust safety stock, reorder points, or maximum inventory to reflect real operational constraints. Without customization, you end up with generic parameters that either trigger frequent stockouts on fast-moving items or build up excess on slower ones. This misalignment increases manual review time, risks service-level drops, and ties up cash in inventory.
In Business Central, the Sales and Inventory Forecast extension (or similar setup) generates predictions via Azure ML and displays them in fact boxes or entries. However, applying those predictions to planning requires separate steps, and item cards retain static or manually entered values for the Planning FastTab fields. Lead time logic pulls from SKU, Item, or Vendor cards in a defined hierarchy, but forecasts themselves do not dynamically feed into reorder calculations unless extended.
The Enhanced Forecasting Worksheet changes this by letting you define expressions that incorporate both historical usage and forecasted quantities. You set these once on the Enhanced Forecast Setup page, and the worksheet evaluates them for each item and period when you calculate the forecast.
- Navigate to Enhanced Forecast Setup in Business Central.
- Open Sales and Inventory Forecast Setup to confirm Azure ML configuration (e.g., algorithm selection).
- Return to Enhanced Forecast Setup.
-
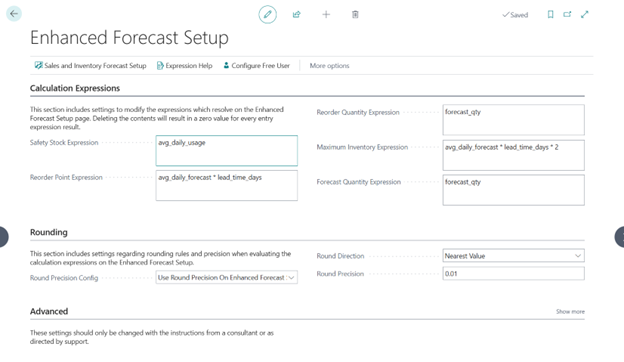
Enter expressions in the planning parameter fields. Use available variables such as avg_daily_usage (historical average daily consumption over the selected past periods), avg_daily_forecast (forecast_qty divided by forecast_days), lead_time_days (resolved from SKU/Item/Vendor hierarchy, defaulting to 1 if blank), forecast_qty (Azure ML predicted quantity for the period), and forecast_days (length of the forecast range). Examples include:
- Safety Stock Expression: avg_daily_usage (simple buffer based on history)
- Reorder Point Expression: avg_daily_forecast * lead_time_days (covers expected demand during lead time)
- Maximum Inventory Expression: avg_daily_forecast * lead_time_days * 2 (provides two lead times of coverage)
- Reorder Quantity Expression: forecast_qty (aligns lot size to predicted period demand)
- Optionally set Round Direction and Round Precision to control how calculated values round (e.g., up to the nearest case pack size).
These expressions evaluate automatically in the worksheet. For a distribution company with variable supplier lead times, set Reorder Point to avg_daily_forecast * lead_time_days + (avg_daily_usage * 0.5) to add a small buffer for usage variability. For seasonal items, you might adjust with conditional logic if the expression evaluator supports it (e.g., IF statements based on period).
To apply this in practice:
- Open the Enhanced Forecasting Worksheet.
- Set filters (e.g., Item Category for a product line, single Location if SKUs exist).
- Define periods (e.g., No. of Forecast Periods = 6 months, No. of Past Periods = 12 months for solid history).
- Add Confidence Level or Forecast Algorithm via personalization if needed.
- Select Calculate Forecast. The worksheet populates lines with Azure ML forecast_qty per item/period, plus columns for Safety Stock Quantity, Reorder Point, Maximum Inventory, and Reorder Quantity—each computed from your expressions.
- Review the results line by line.
- Select Update Item Planning to write the calculated values directly to each item’s Planning FastTab (Safety Stock Quantity, Reorder Point, Reorder Quantity, Maximum Inventory).
This keeps parameters current without manual entry on hundreds of item cards. After updating, run the standard MPS/MRP; suggestions now reflect your customized logic based on the latest forecast.
Start with default expressions on a test subset of items to compare against the current manual settings. Adjust one variable at a time (e.g., multiply safety stock for high-value items by a factor) and observe how it affects reorder suggestions. This method gives you and your clients precise, repeatable control that scales with changing demand patterns.