Features of Graphical Scheduler
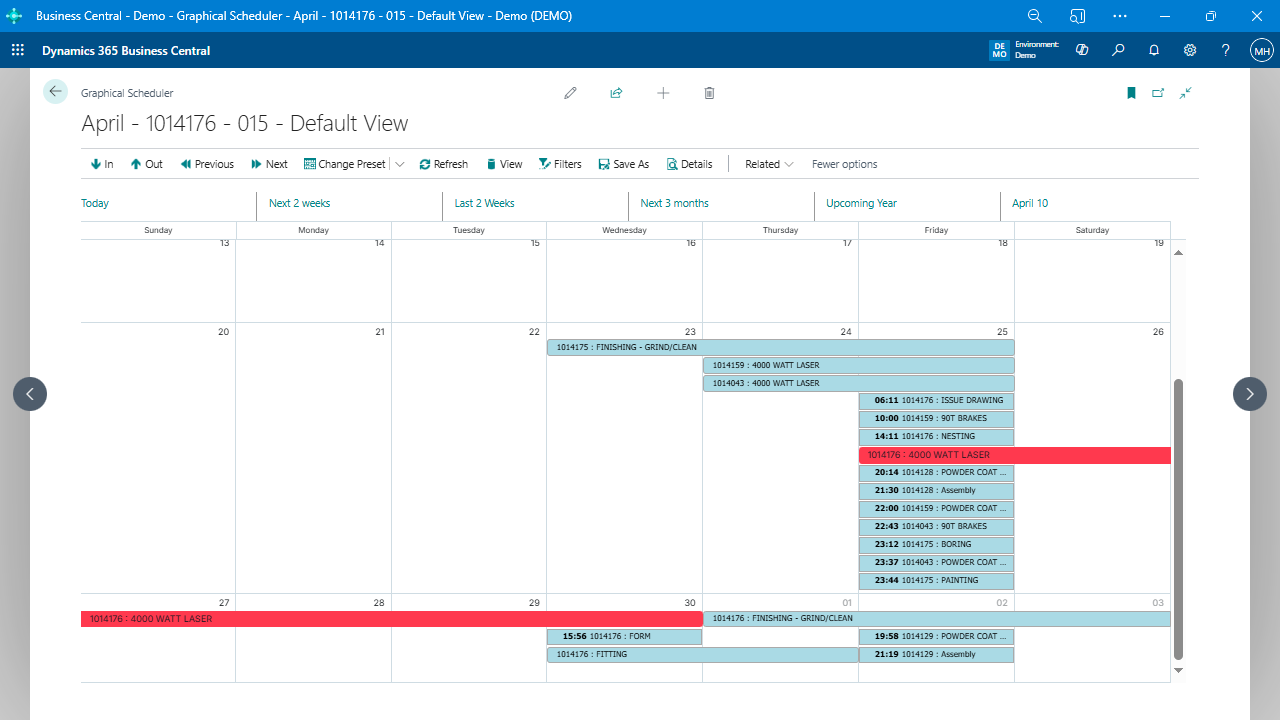
Visualize Work Centers and Machine Centers
Graphical Scheduler displays all work center groups, individual work centers, and machine centers in one view, allowing users to oversee production areas clearly and efficiently.
Setup Wizard for Quick Start
The app provides a setup wizard to guide first-time users through initial configuration. This enables quick access to basic settings and viewing released production orders with minimal setup.
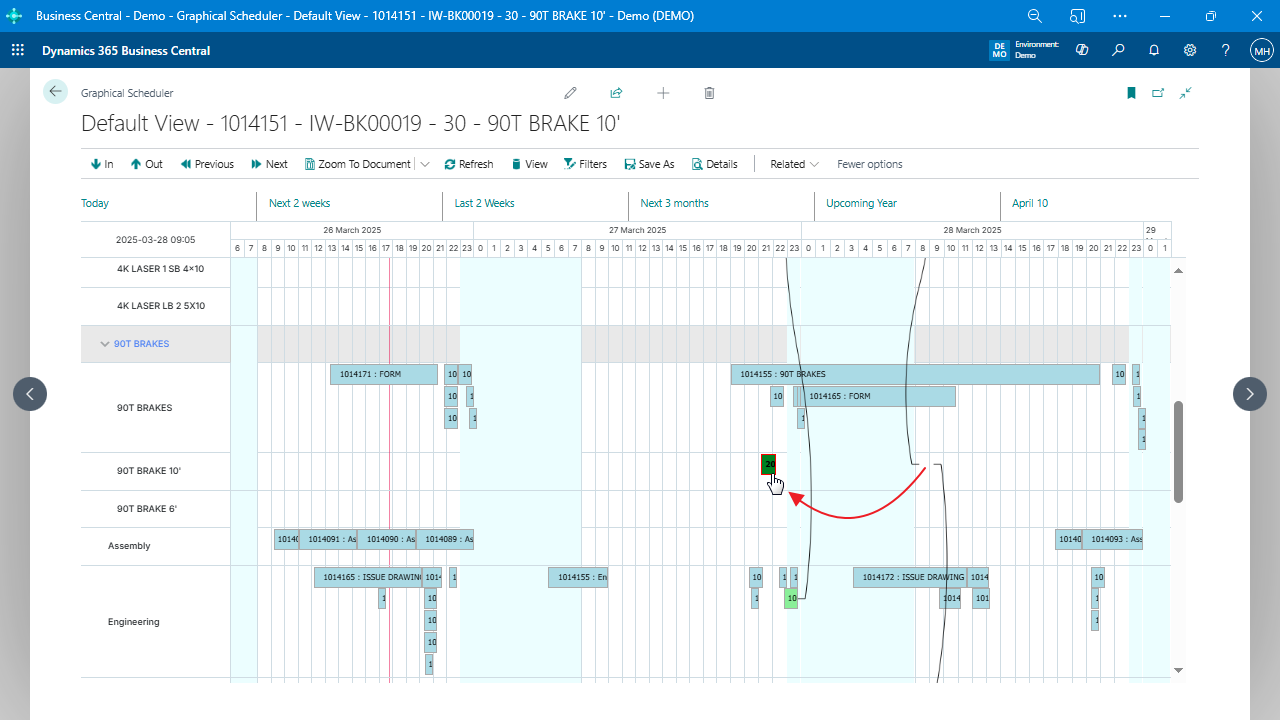
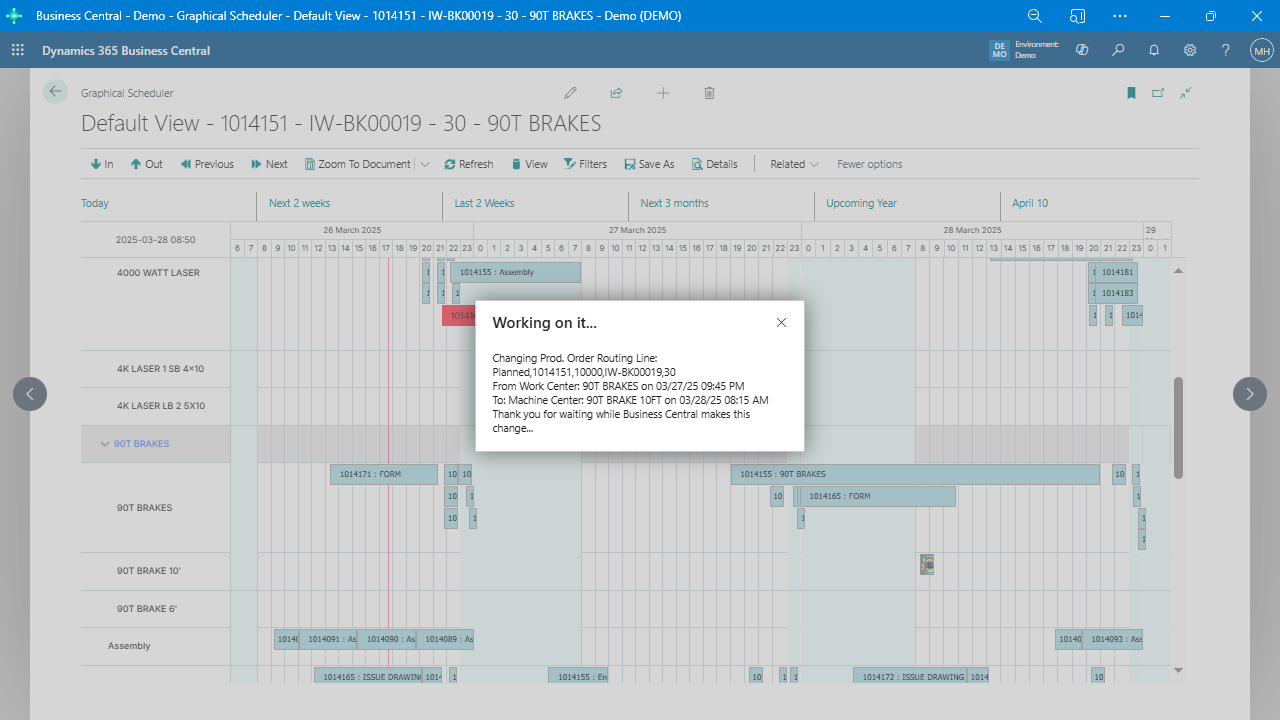
Drag-and-Drop Scheduling
Graphical Scheduler enables users to adjust production dates by dragging and dropping items within the interface, making it easy to implement date-based scheduling changes without complex steps. Drag-and-drop uses standard Business Central logic—changes only affect the selected production order, not others.
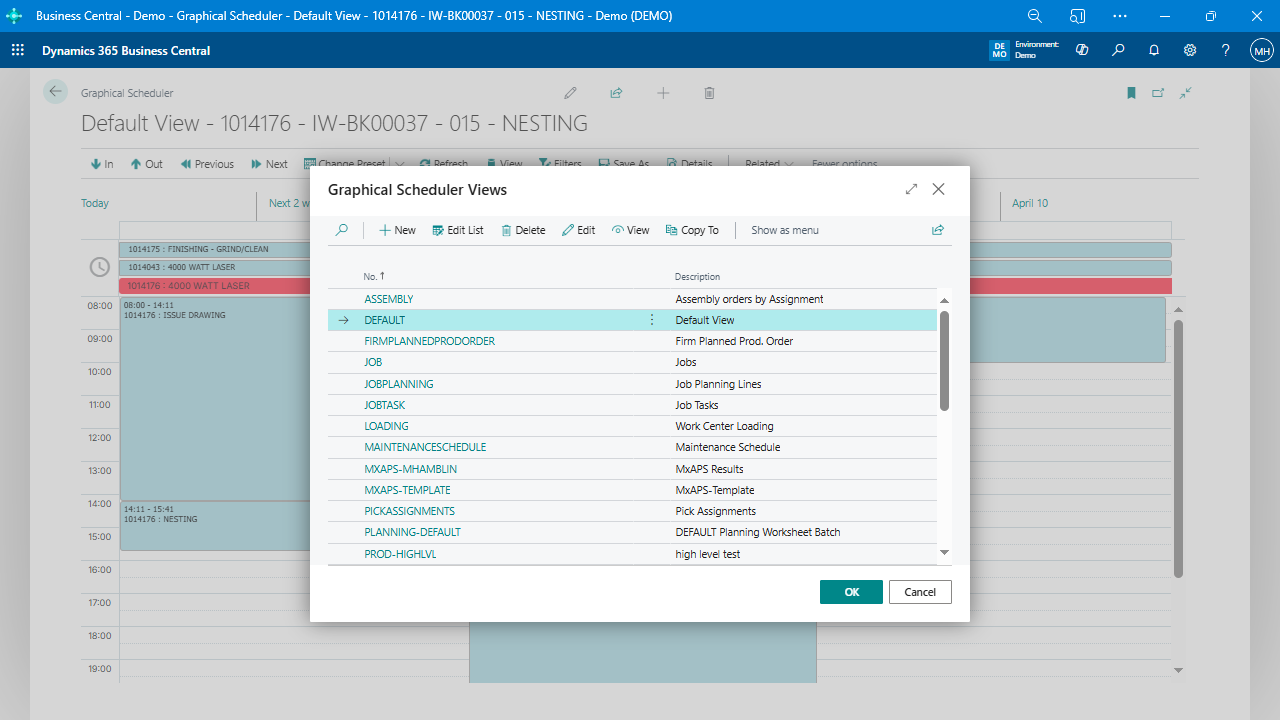
Customizable Views
The app supports multiple pre-configured views with customizable filters, date ranges, and zoom levels, giving users flexibility in how production data is displayed to match specific scheduling needs. Users can also configure presets, display formats, and apply custom styles.
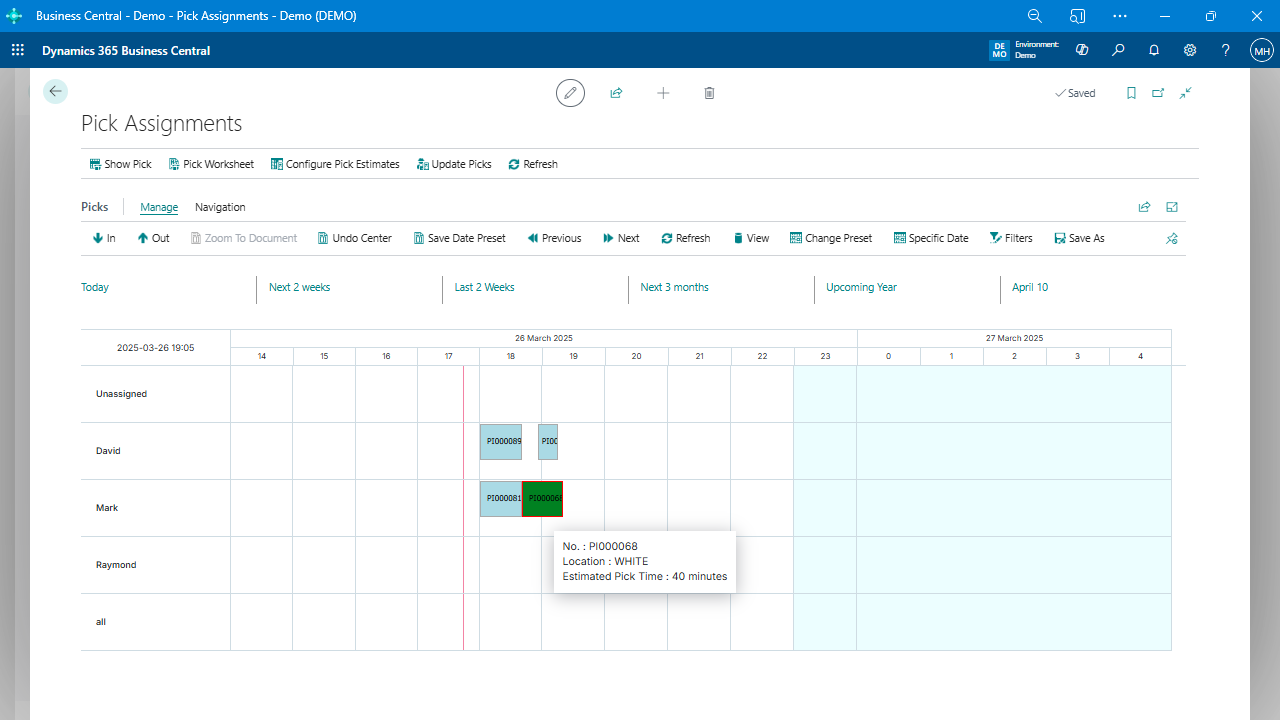
Data Source Configuration
The Graphical Scheduler allows users to display various types of data—such as simulated or released orders—and also supports read-only or editable views. Any table in Business Central, including custom tables, can be configured for scheduling if it has start/end times and resource mappings.
Restrict View by Department or Role
Views can be filtered to show only relevant work centers or machine centers, helping to prevent accidental cross-department scheduling changes.
Calendar Integration for Scheduling
Graphical Scheduler integrates with work center calendars to show shift start and end times. Users can highlight or hide non-working hours and display breaks like lunch or daily pauses.
Color Coding for Visual Cues
Color customization enables users to highlight different statuses, such as planned, released, late, or custom-defined states. Filters for color coding are based on fields from the selected data source.
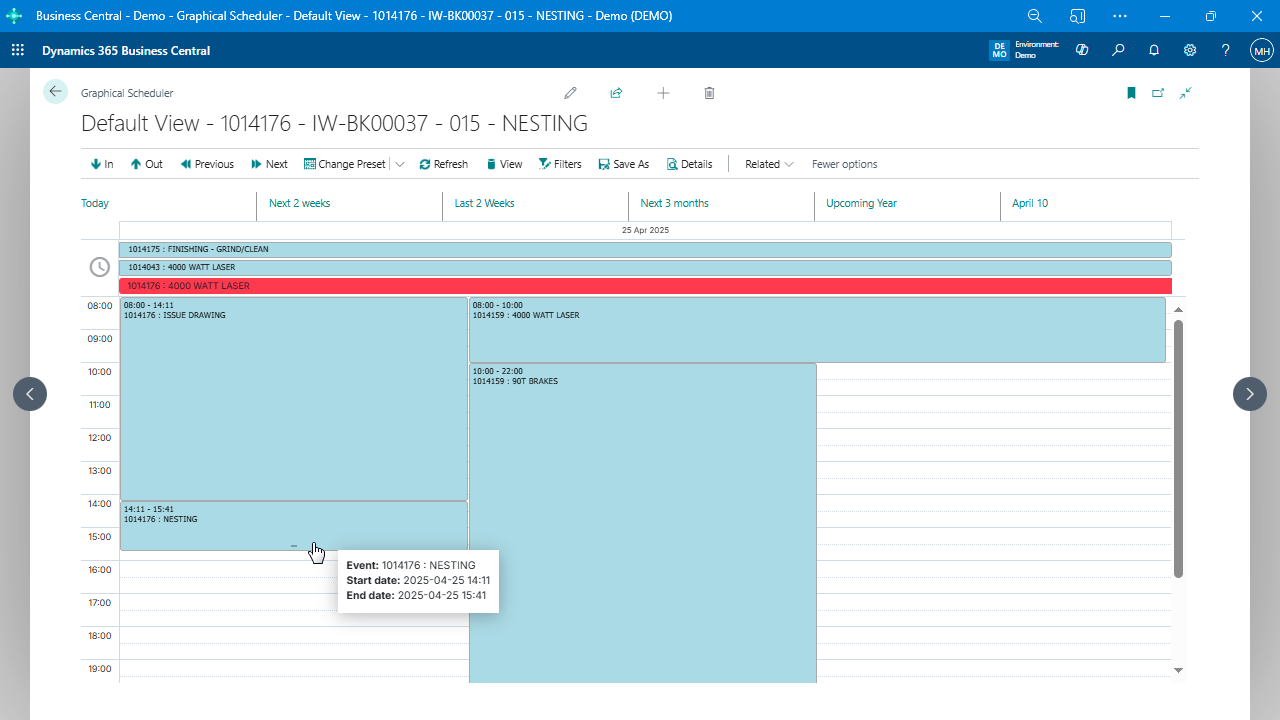
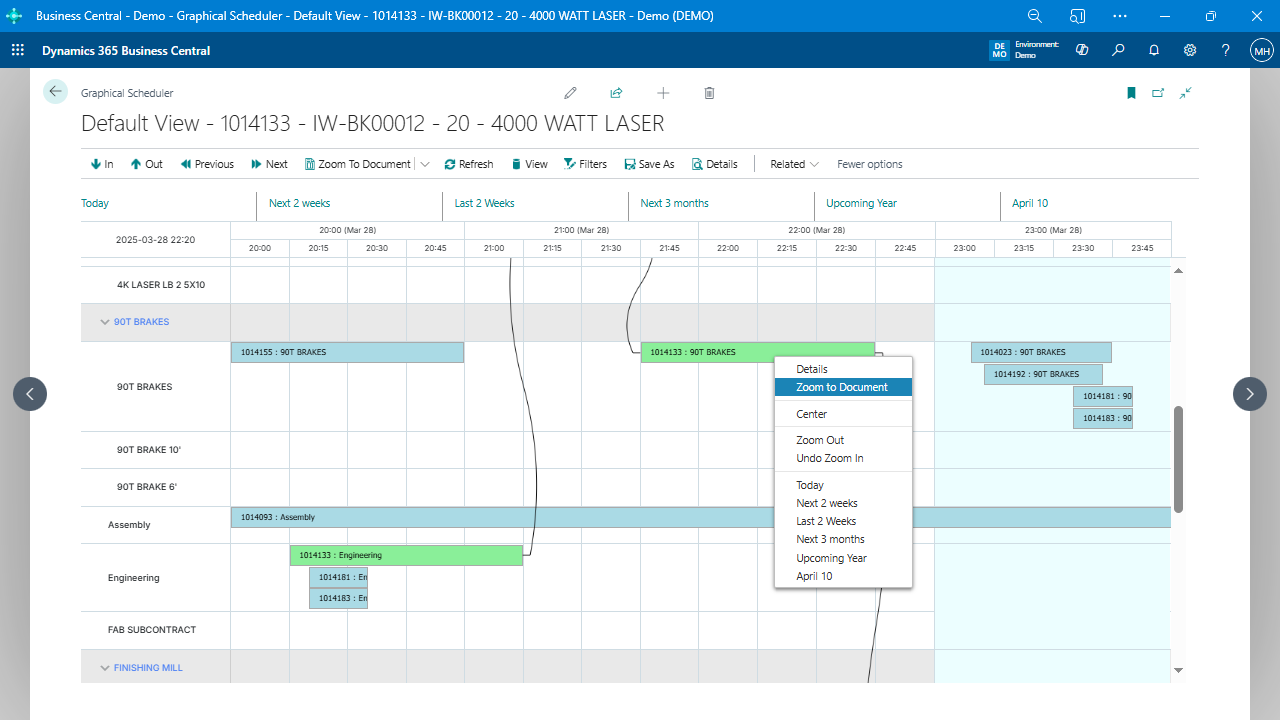
Quick Access to Operation Details
Users can click any operation to quickly access and review detailed production data, making it easy to make informed scheduling decisions.
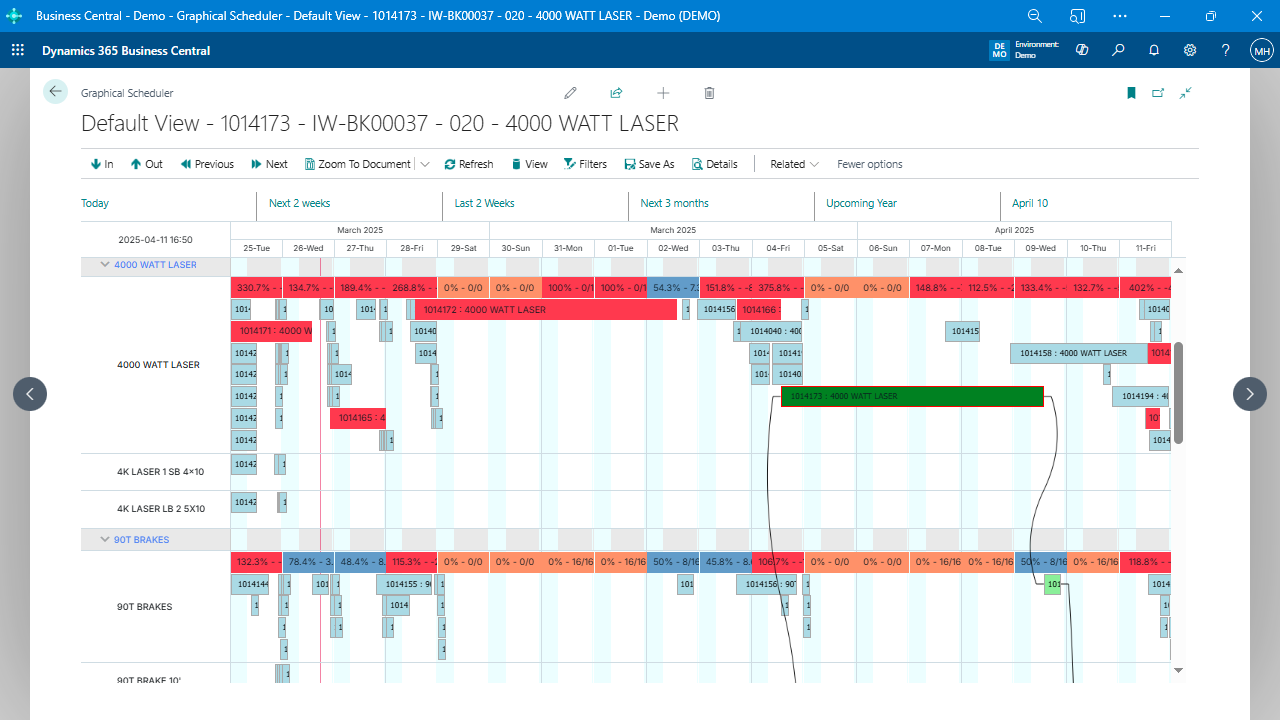
View Work Center Loading and Overcapacity
Overlay visual indicators to show current or future load by work center. Colors indicate utilization thresholds to help identify overloaded areas at a glance.
Show Machine Downtime or Maintenance
Using registered absences or custom records, users can display planned maintenance or machine downtime directly on the scheduler.
Support for 15-Minute and Single-Day Increments
Users can zoom in to see detailed views down to 15-minute increments or focus on a single day for shift-level scheduling.